
Interactive visualization of an investigative report
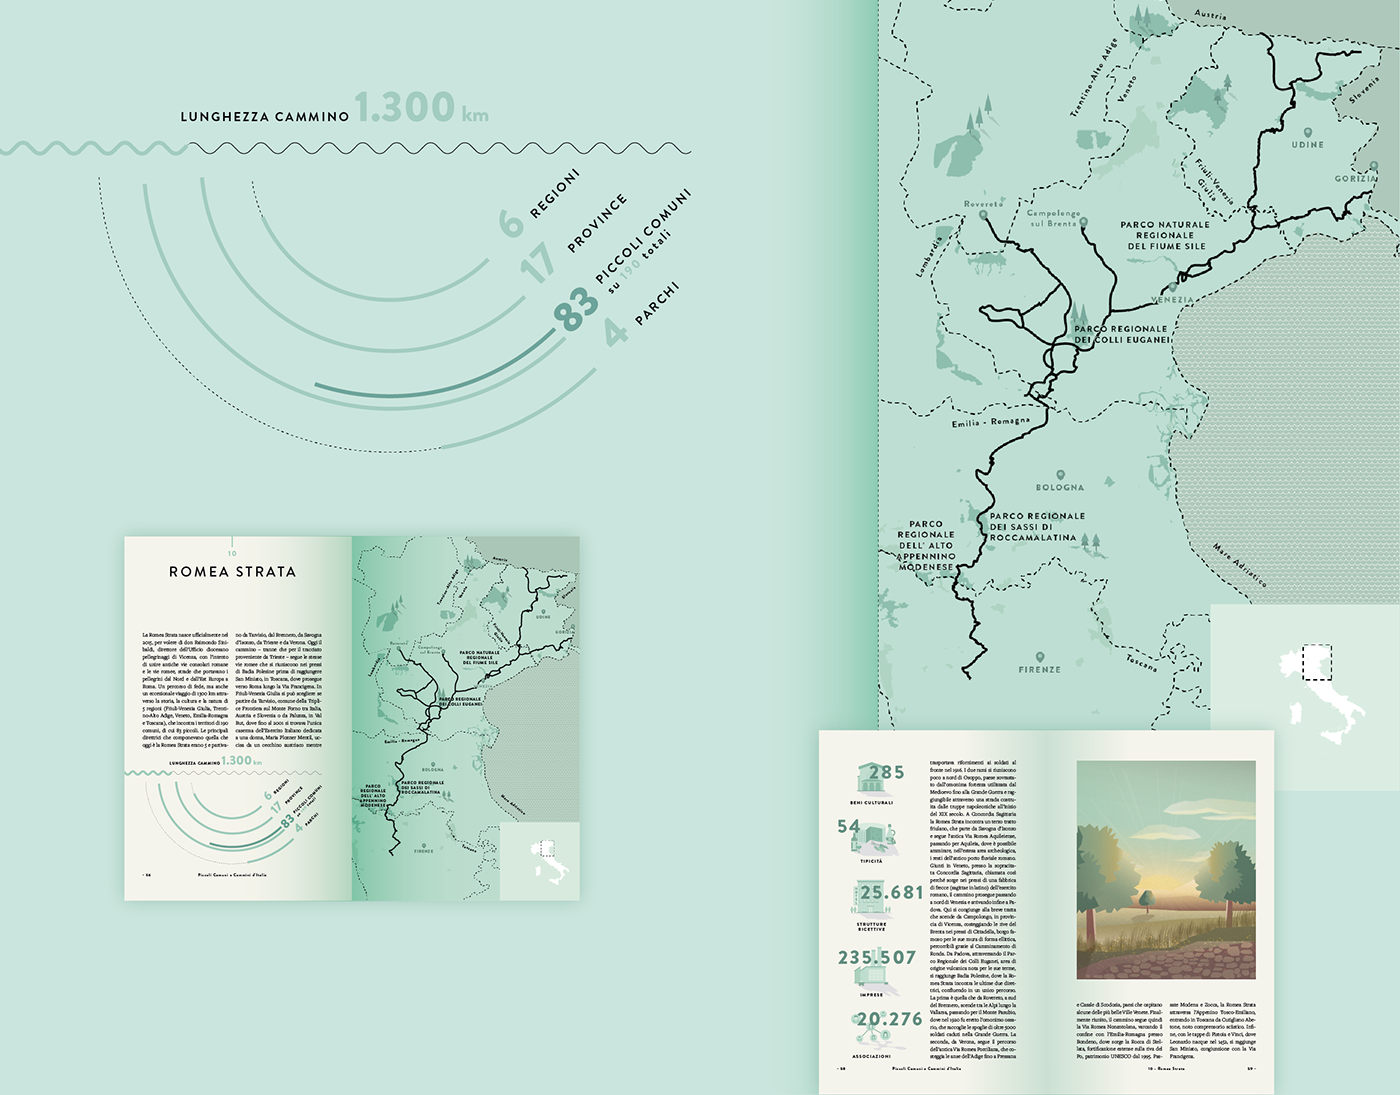
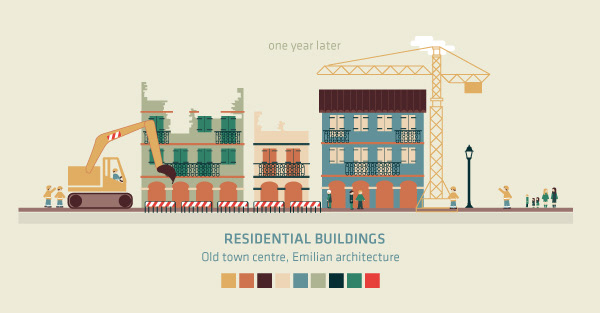
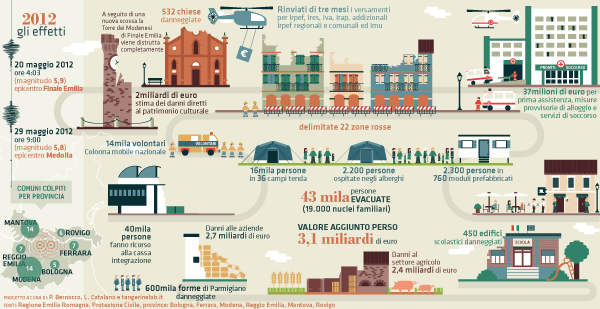
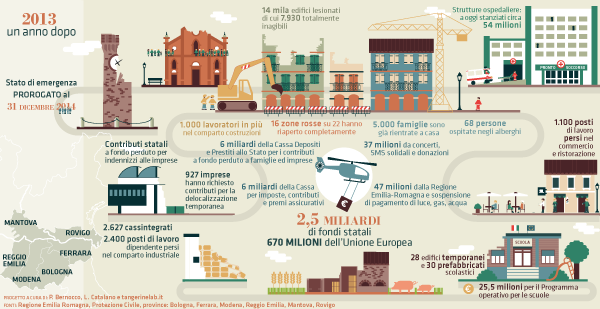
WHY - The aim of this project is to hold the attention on the Earthquake in Emilia (Italy, 20th and 29th May 2012) exactly 1 year later to show how many things are already done and how many not yet.
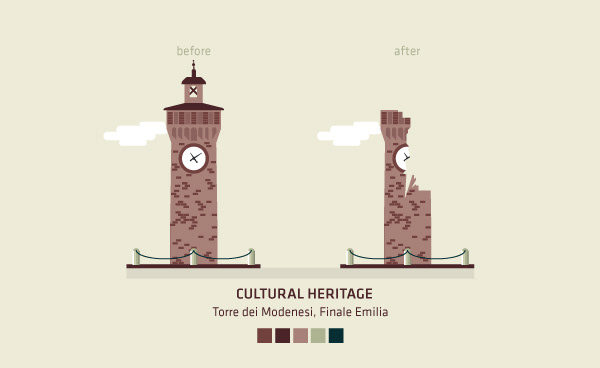
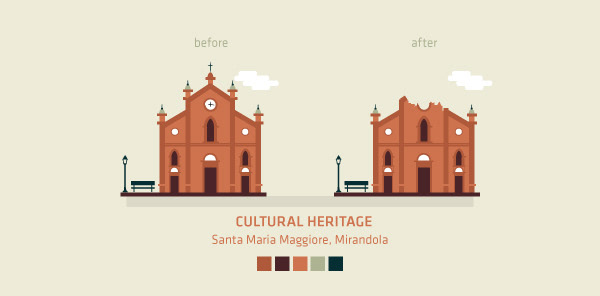
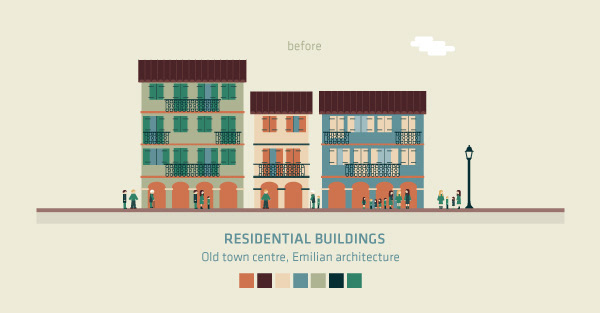
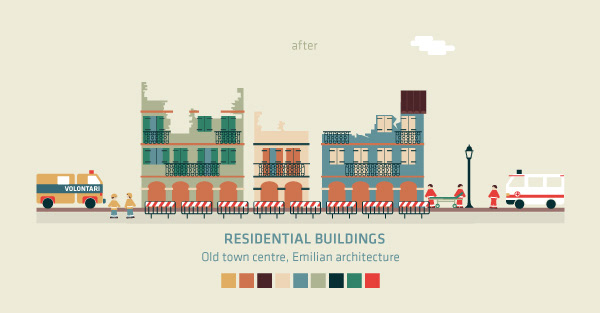
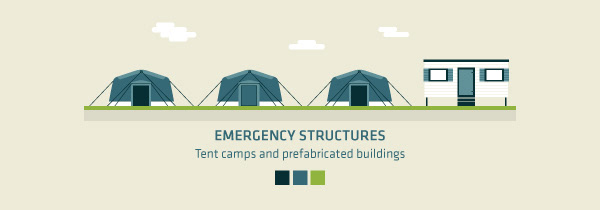
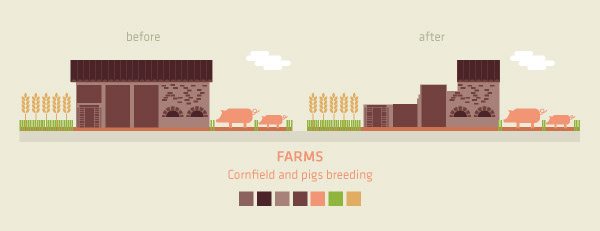
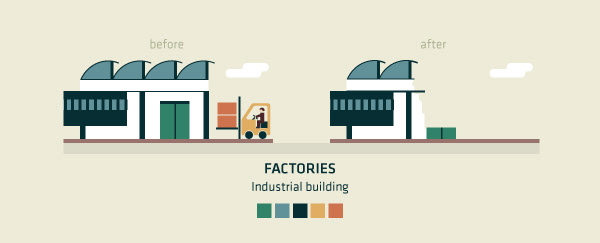
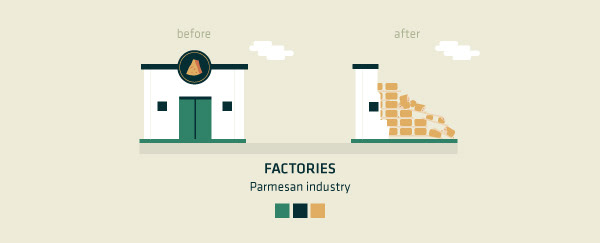
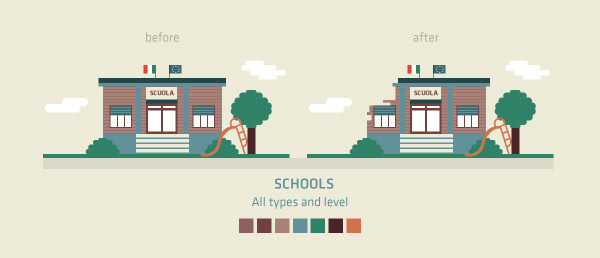
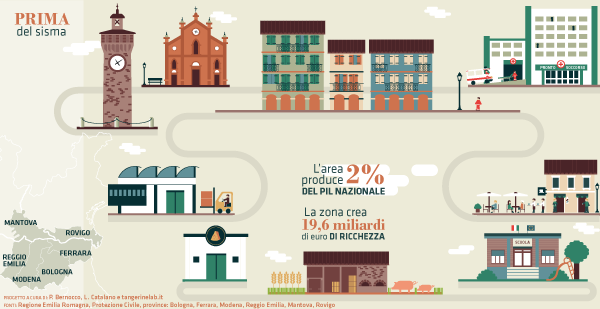
HOW - Published on the newspaper La Stampa, this data visualization is composed by 3 different state: the condition in the Emilian area before the earthquake, the condition during the days after and the condition one year later. The visual comparison among the 3 moments allows the direct interpretation of the data.
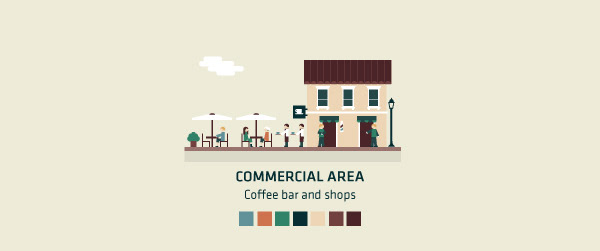
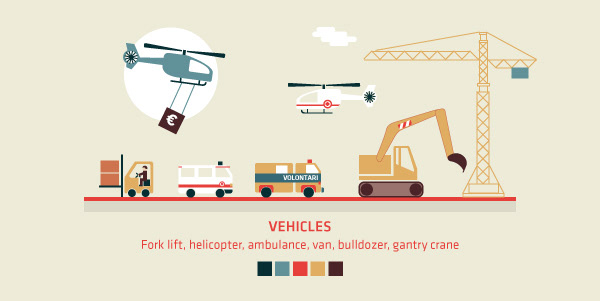
WHERE - The illustrations are inspired by the real Emilian architecture (Romanical and Medieval influences) to represent the area involved as more realistically as possible.
-
TEAM - This project is made by a team composed by Tangerinelab (who make the art direction and the graphical development) + Paolo Bernocco and Lidia Catalano (who make the journalist researches and contents).


tangerinelab.it
follow us on: facebook - twitter
follow us on: facebook - twitter